Overview
A GIS map is a digital map created using Geographic Information System (GIS) technology, which allows users to capture, store, analyze, and visualize spatial and geographic data. These maps combine layers of information, such as roads, terrain, population, and natural resources, to provide a comprehensive view of a specific area.
Lake Rover uses GIS maps to help users visualize different regions of a lake. Those regions are:
- Invasive plants found
- Suspicious looking plants found
- No invasive plants found
- Region has not been surveyed
Navigating Our GIS Map
Zooming
| Mouse | Use the wheel to zoom in / out |
| Mobile, Tablet | Use 2 fingers to zoom in / out |
A Lake Rover GIS map defaults to a satellite view. The readily available satellite maps have limited resolution. Meaning, when you zoom in enough, the view becomes blurry. Not to worry, there is usually enough clarity for our purposes.
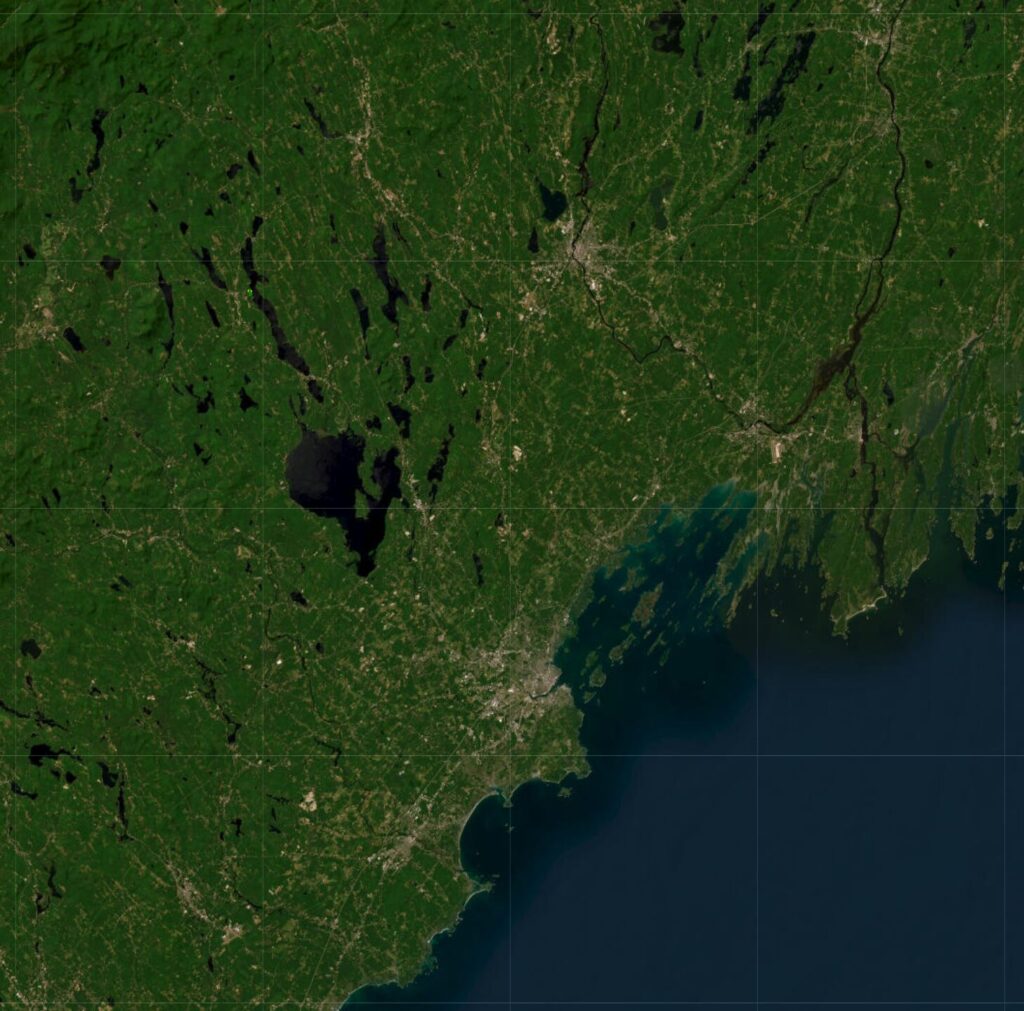
Satellite image with Sebago Lake near the center, Atlantic ocean in bottom right corner.
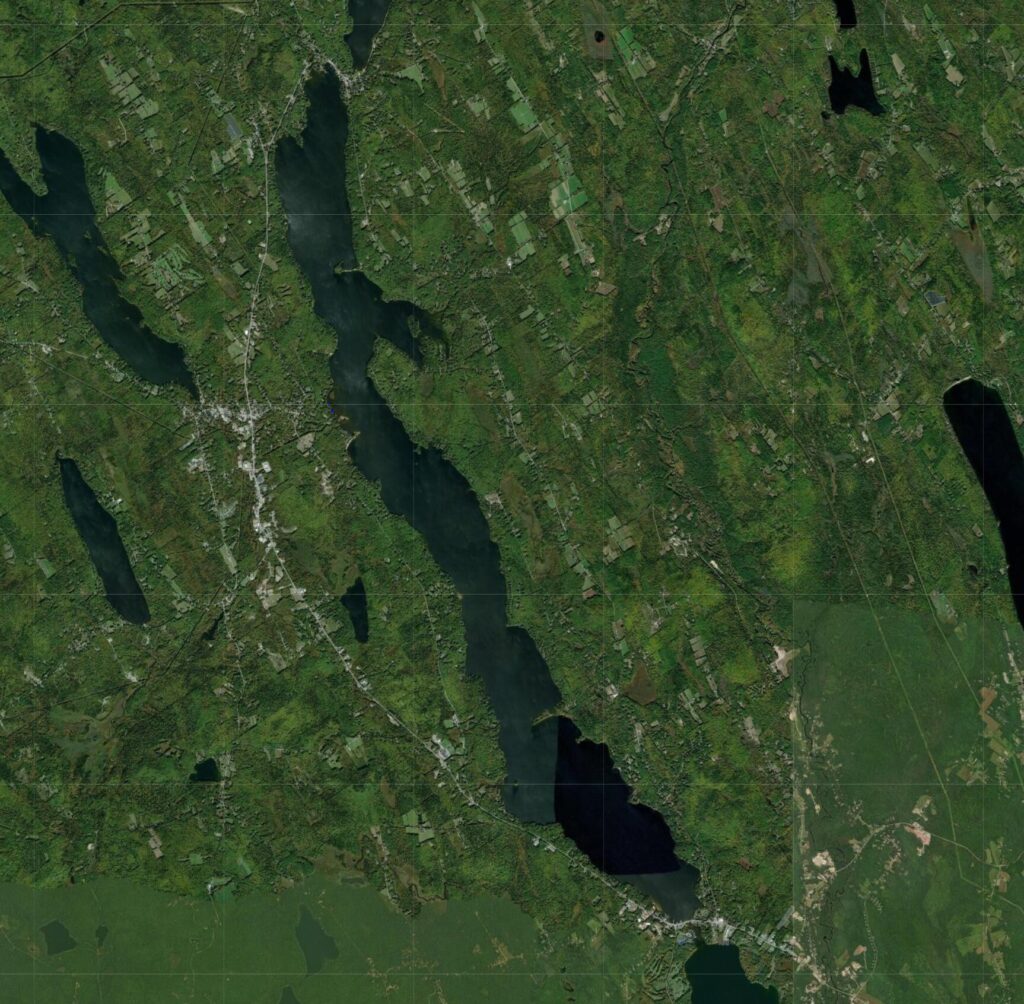
Zoomed in on Long Lake
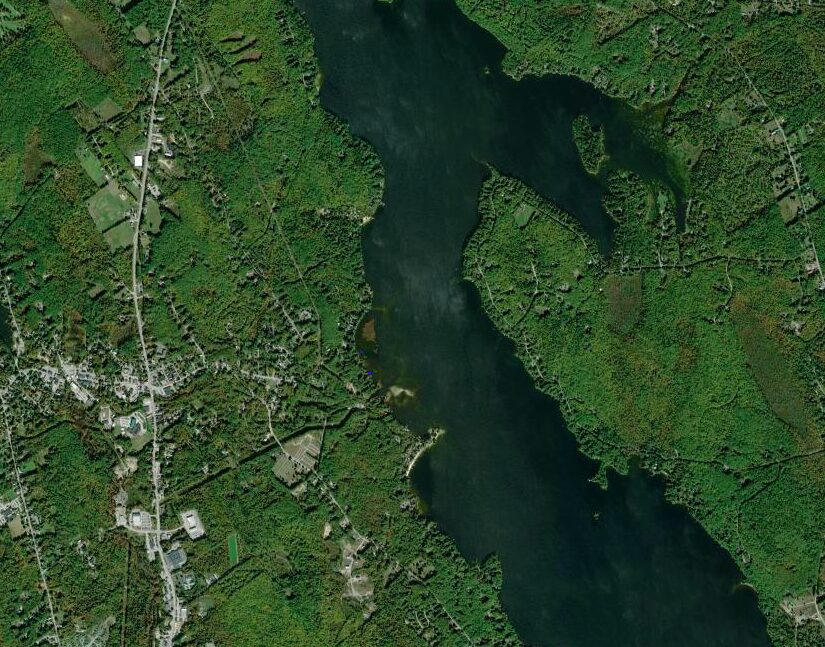
Zoomed in on Bridgton and Cape Monday of Long Lake, Plummers Landing Cove is at the center
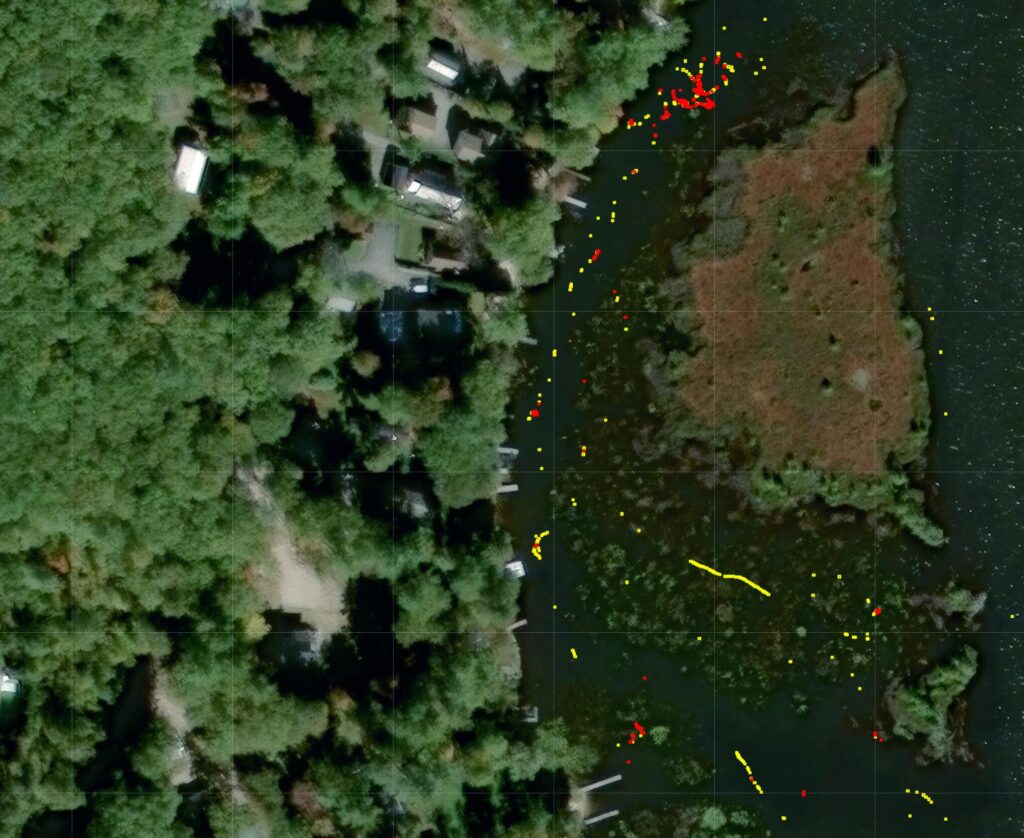
Zoomed in on the north end of Plummers Landing Cove of Long Lake.
The Invasive markers (red) and the Suspicious markers (yellow) have been enabled.
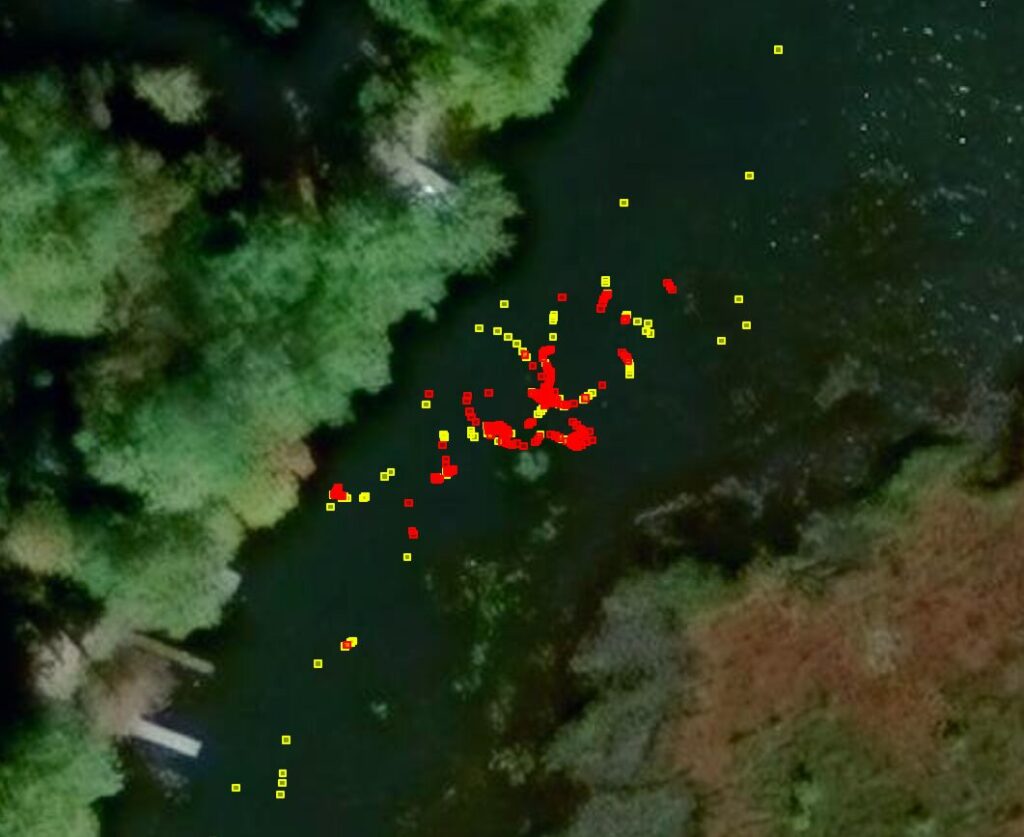
Zoomed in on the north end of Plummers Landing Cove of Long Lake
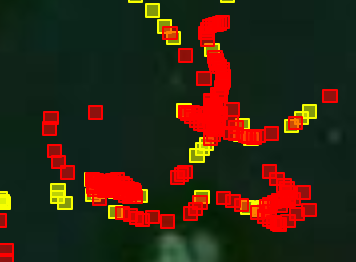
Zoomed in on the dense cluster of Invasive markers
the locations where invasive plants were found as well as regions where no invasive plants were found.
Markers
Markers are graphics that are overlaid on a GIS map. Lake Rover uses the following markers.
| Marker | Meaning |
 | Invasive Plant Marker Red markers identify the location where an invasive plant was found. |
 | Suspicious Plant Marker Yellow markers identify the location where a possible invasive plant was found; the confidence level was not high enough to call this an invasive plant or an OK. |
 | OK Marker Green markers identify the location where no invasive plants were found. |
There is a legend in the bottom left corner of the map identifying the different markers.
Layers
GIS maps allow you to control what is displayed through the use of layers.
There is always a base layer. The base layer is always a map and is always displayed. There are several types of maps available: satellite, topographic, street maps, etc..
The non-base layers provide additional information that is overlaid on the map. Each non-base layer can be turned on or off using the layer control in the top right corner of the map. Lake Rover uses 3 layers to control displaying the 3 different marker types.
Use the layer control in the top right corner of the map to change the type of map and to control display of the markers.